Crash Scenario
Road Crashes
Scenario in Rajasthan
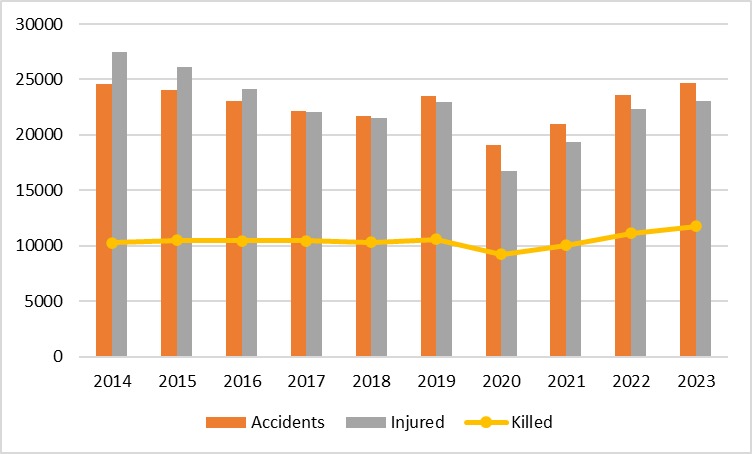
Road crashes and resulting fatalities is a serious issue in Rajasthan. On an average more than ten thousand people lost lives in Rajasthan every year. According to the report published by MoRTH, Rajasthan ranks 5th in terms of road crash deaths and 9th in terms of road accidents that were reported in year 2021. In year 2022, number of road accidents, deaths and injuries increased significantly in the state. An overview or road crashes, deaths and injuries occurred in Rajasthan during 2013 to 2022 followed by in-depth analysis of road crashes reported in year 2022 is depicted in the subsequent sections.
Summary of Road Crashes in Rajasthan (2014 to 2023)
| S. No. | Year | Accidents | Injured | Killed |
|---|---|---|---|---|
| 1 | 2014 | 24628 | 27453 | 10289 |
| 2 | 2015 | 24072 | 26153 | 10510 |
| 3 | 2016 | 23066 | 24103 | 10465 |
| 4 | 2017 | 22112 | 22071 | 10444 |
| 5 | 2018 | 21743 | 21547 | 10320 |
| 6 | 2019 | 23480 | 22979 | 10563 |
| 7 | 2020 | 19114 | 16769 | 9250 |
| 8 | 2021 | 20951 | 19344 | 10043 |
| 9 | 2022 | 23614 | 22293 | 11104 |
| 10 | 2023 | 24705 | 23041 | 11762 |
Road Accidents, Killed and Injured in Rajasthan (2014 to 2023)
Comparative Analysis of Road Accidents (2022 and 2023)
| S. No. | Parameter | 2022 | 2023 | + / - | %age |
|---|---|---|---|---|---|
| 1 | Accidents | 23614 | 24705 | 1091 | +5% |
| 2 | Deaths | 11104 | 11762 | 658 | +6% |
| 3 | Injured | 22293 | 23041 | 748 | +3% |
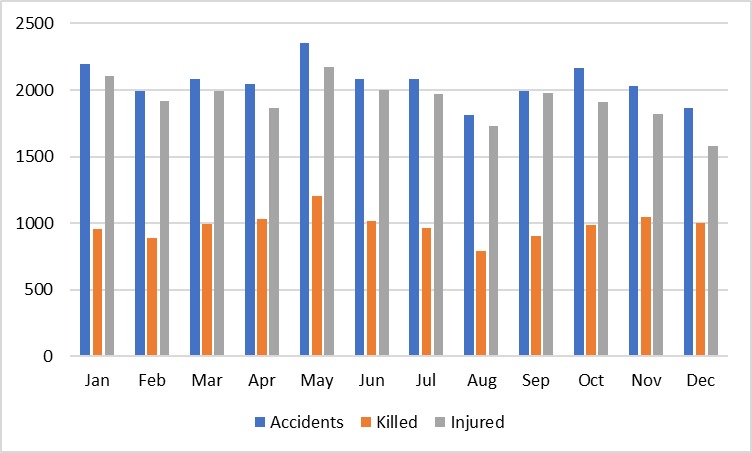
Month-wise Road Accidents, Killed and Injured (2023)
| S. No. | Month | Accidents | Killed | Injured |
|---|---|---|---|---|
| 1 | Jan | 2199 | 956 | 2105 |
| 2 | Feb | 1991 | 891 | 1915 |
| 3 | Mar | 2083 | 991 | 1995 |
| 4 | Apr | 2047 | 1028 | 1861 |
| 5 | May | 2355 | 1201 | 2176 |
| 6 | Jun | 2085 | 1017 | 1999 |
| 7 | Jul | 2081 | 961 | 1972 |
| 8 | Aug | 1813 | 793 | 1727 |
| 9 | Sep | 1995 | 899 | 1980 |
| 10 | Oct | 2165 | 983 | 1908 |
| 11 | Nov | 2030 | 1043 | 1822 |
| 12 | Dec | 1861 | 999 | 1581 |
| TOTAL | 24705 | 11762 | 23041 | |
Month-wise Road Accidents, Killed and Injured in Rajasthan (2022)
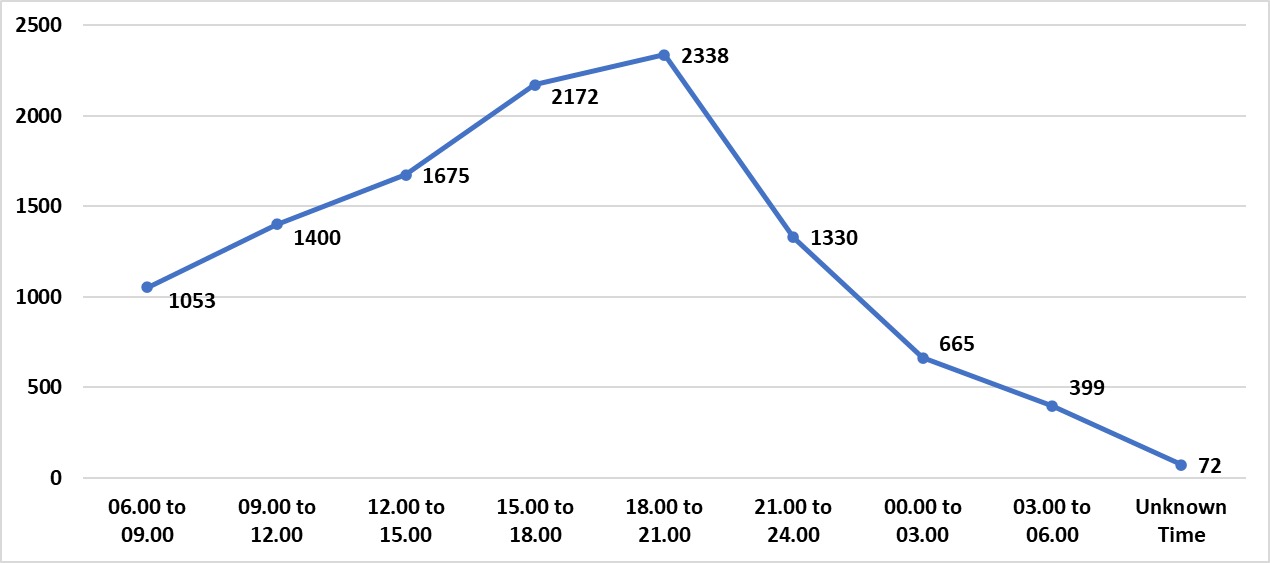
Road Accidents, Killed and Injured According to Time (2022)
| S. No. | Time Slab | Accidents | Killed | Injured |
|---|---|---|---|---|
| 1 | 06.00 to 09.00 | 2394 | 1053 | 2246 |
| 2 | 09.00 to 12.00 | 3323 | 1400 | 3344 |
| 3 | 12.00 to 15.00 | 3828 | 1675 | 3677 |
| 4 | 15.00 to 18.00 | 4515 | 2172 | 4340 |
| 5 | 18.00 to 21.00 | 4740 | 2338 | 4466 |
| 6 | 21.00 to 24.00 | 2693 | 1330 | 2380 |
| 7 | 00.00 to 03.00 | 1193 | 665 | 1015 |
| 8 | 03.00 to 06.00 | 759 | 399 | 685 |
| 9 | Unknown Time | 169 | 72 | 140 |
| TOTAL | 23614 | 11104 | 22293 | |
Number of Persons Killed According to Time of Road Accident (2022)
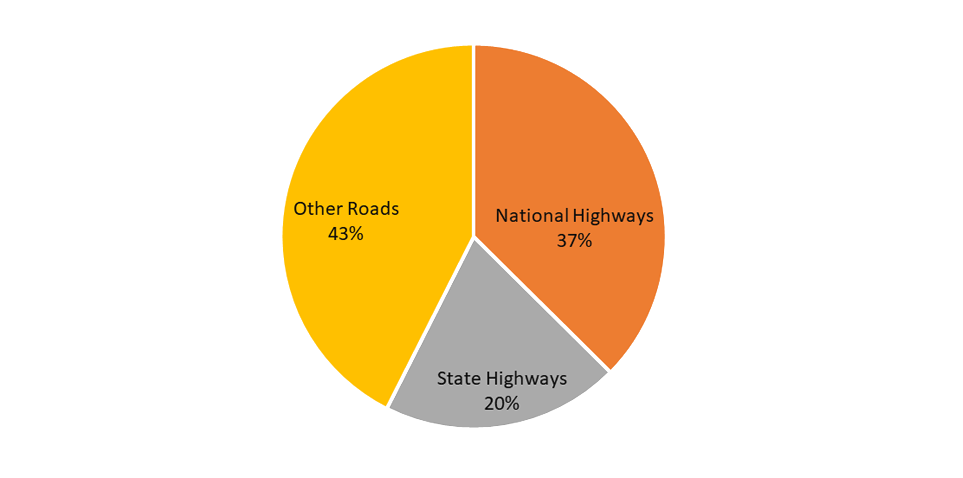
Road Accidents, Killed and Injured According to Road Category (2022)
| S. No. | Road Category | Accidents | Killed | Injured |
|---|---|---|---|---|
| 1 | Expressways | 0 | 0 | 0 |
| 2 | National Highways | 7093 | 4156 | 6924 |
| 3 | State Highways | 4160 | 2224 | 4143 |
| 4 | Other Roads | 12361 | 4724 | 11226 |
| TOTAL | 23614 | 11104 | 22293 | |
Percentage Share of People Killed According to Category of Road (2022)
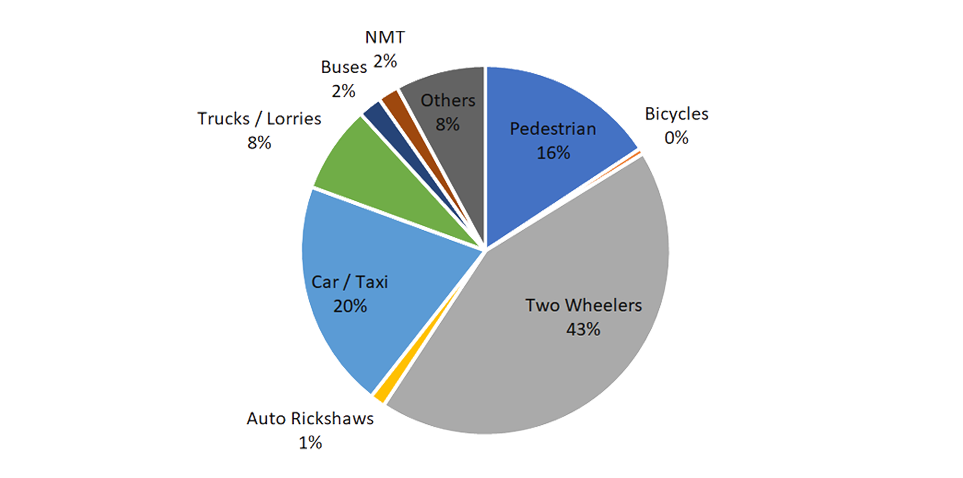
Road Accidents, Killed and Injured According to Road Users (2022)
| S. No. | Road Users | Accidents | Killed | Injured |
|---|---|---|---|---|
| 1 | Pedestrian | 3715 | 1745 | 2454 |
| 2 | Bicycles | 100 | 55 | 74 |
| 3 | Two Wheelers | 9275 | 4782 | 9037 |
| 4 | Auto Rickshaws | 331 | 145 | 409 |
| 5 | Car / Taxi | 5304 | 2221 | 5539 |
| 6 | Trucks / Lorries | 1989 | 848 | 1518 |
| 7 | Buses | 625 | 226 | 1071 |
| 8 | NMT | 513 | 204 | 368 |
| 9 | Others | 1762 | 878 | 1823 |
| TOTAL | 23614 | 11104 | 22293 | |
Percentage Share of Persons Killed According to Road Users (2022)
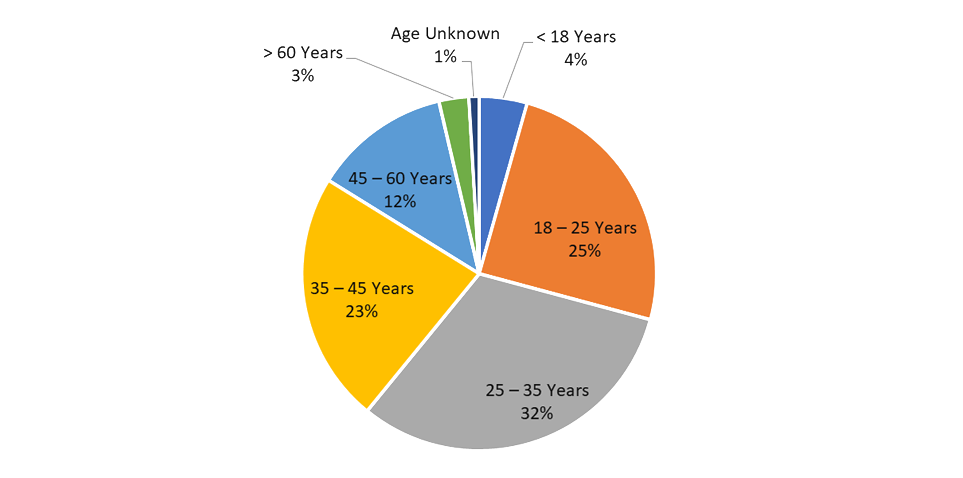
Persons Killed and Injured According to Age Group (2022)
| S. No. | Age Group | Killed | Injured |
|---|---|---|---|
| 1 | < 18 Years | 485 | 1123 |
| 2 | 18 – 25 Years | 2755 | 5619 |
| 3 | 25 – 35 Years | 3523 | 6684 |
| 4 | 35 – 45 Years | 2546 | 5234 |
| 5 | 45 – 60 Years | 1389 | 2682 |
| 6 | > 60 Years | 302 | 691 |
| 7 | Age Unknown | 104 | 260 |
| TOTAL | 11104 | 22293 | |
Percentage Share of Persons Killed According to Age Group (2022)
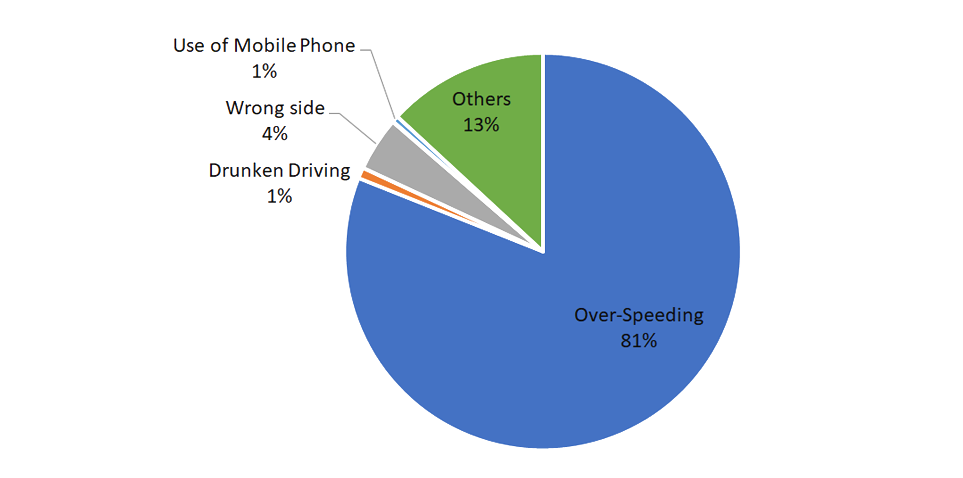
Road Accidents, Killed and Injured According to Traffic Violations (2022)
| S. No. | Traffic Violation | Accidents | Killed | Injured |
|---|---|---|---|---|
| 1 | Over-Speeding | 18963 | 8998 | 17948 |
| 2 | Drunken Driving | 212 | 98 | 238 |
| 3 | Wrong side | 1043 | 491 | 1053 |
| 4 | Jumping Red Light | 15 | 4 | 25 |
| 5 | Use of Mobile Phone | 131 | 58 | 142 |
| 6 | Others | 3250 | 1455 | 2887 |
| TOTAL | 23614 | 11104 | 22293 | |
Percentage of Persons Killed According to Traffic Violation (2022)